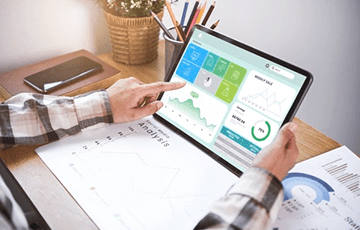
Effective planning & analytics is the foundation of a successful project. Modern-day construction requires agility, foresight, and precision for managing timelines, budgets to coordination of teams and resources.
This is where construction analytics & planning softwares’ can help your business in streamlining operations, improving collaboration, and minimizing errors.
As they integrate advanced technologies like real-time data analytics, project scheduling, and resource optimization, they contribute towards the overall cost effectiveness and sustainability of the project.
So let us explore how Maventic’s Construction Management Planning & Analytics Suite can help your business in ensuring projects are delivered on time.
What is Maventic’s Construction Management Planning & Analytics Suite?
It is a planning & analytical suite that is developed on the SAP Analytics Cloud (SAC) platform, which provides businesses with a comprehensive set of tools for planning, scheduling, quality, and resource & material management.
The suite offers various dashboards covering key performance indicators (KPIs) essential for effective construction management, which helps project managers and stakeholders gain a clear understanding of resource allocation, project progress, cost management, and quality control.
Stay on top of your projects
Maventic’s Construction Management Planning & Analytics Suite gives users access to a planning workbook for critical resource allocation and six different dashboards for project management.
1. Critical resource planning workbook
The workbook assists organizations in planning the number of human resources and duration needed for each project. To make planning easier, there are multiple filters which allow users to plan for a particular resource based on the selected date and project. Depending on the plan, it shows the estimated cost for each resource as well.
2. Project progress dashboard
It showcases critical KPIs that help in monitoring project progress. Users can access reports to analyze the cost, duration, man hours and inception of a selected project.
3. Resource management dashboard
This dashboard gives an overview of planned vs.actual cost and resource quantities of the selected project over time. Thanks to its simplified UI and project-specific filters, users of different levels can easily analyze data.
Businesses can access planned data in real-time as it is integrated with the resource planning workbook.
4. Finance dashboard
Organizations can view and analyze their financial data, which covers KPIs like revenue, bank balance, loan amount, tax, income, expenses and cashflow.
5. Safety management dashboard
Provides data on the accidents on-site and the effects of the incident taken place, along with the damages (cost and human) due to it.
6. Quality management dashboard
Businesses can access KPIs, which help in monitoring the quality of projects. Users can gather insights from the inspection data such as ratings, defects, NCR reports, rework time and cost
7. Real estate dashboard
This dashboard is divided into three separate tabs for ease of convenience;
- The first tab analyzes the rent of different properties. Which includes loss due to vacant properties, rent by area and property type.
- While the second tab includes financial KPIs like profit, loss, income, expenses, and taxes.
- Coming to the third tab, it contains features related to banks, such as bank balance, ROI, etc. that are integrated with the financials tab.
Features of Maventic’s Construction Management Planning & Analytics Suite
Data and version management: Users can seamlessly create private and public versions of the projects based on different categories like forecast, budget, planning, and actual. It also supports the maintenance, creation, and deletion of different versions across the planning tree.
Simple and user-friendly UI: The dashboard, launchpad and workbook have a clean and simple UI. To make it user-friendly, the dashboard also contains filters such as hide button, home button and popups for deeper insights.
Interlinked dashboards: All the dashboards in the suite are interlinked in terms of KPIs. Thanks to the seamless integration of data from various sources, it helps in creating a centralized repository for planning & reporting activities.
Get deeper insights: Popup charts provide detailed information on the KPIs your business is focusing on. Every chart has a graph-like icon that gives a breakdown of all the important information of the selected visualization.
Why choose Maventic’s Construction Management Planning & Analytics Suite?
With 70+ analytics experts who have worked across 20+ SAC projects, 10+ Non-SAP projects, and 5+ Datasphere projects, we offer analytics services covering multiple platforms including SAP ERP, CRM, SCM, CAR, and Non-SAP Data Sources.
We can help your business with implementation, support services, performance optimization, and audit processes.


